
UAIR provides a number of educational opportunities to help you make the most out of UAccess Analytics and other data resources. From interactive training modules to dashboard tours, this page is the place to go to learn about UAccess Analytics and more.
UAccess Analytics Certification
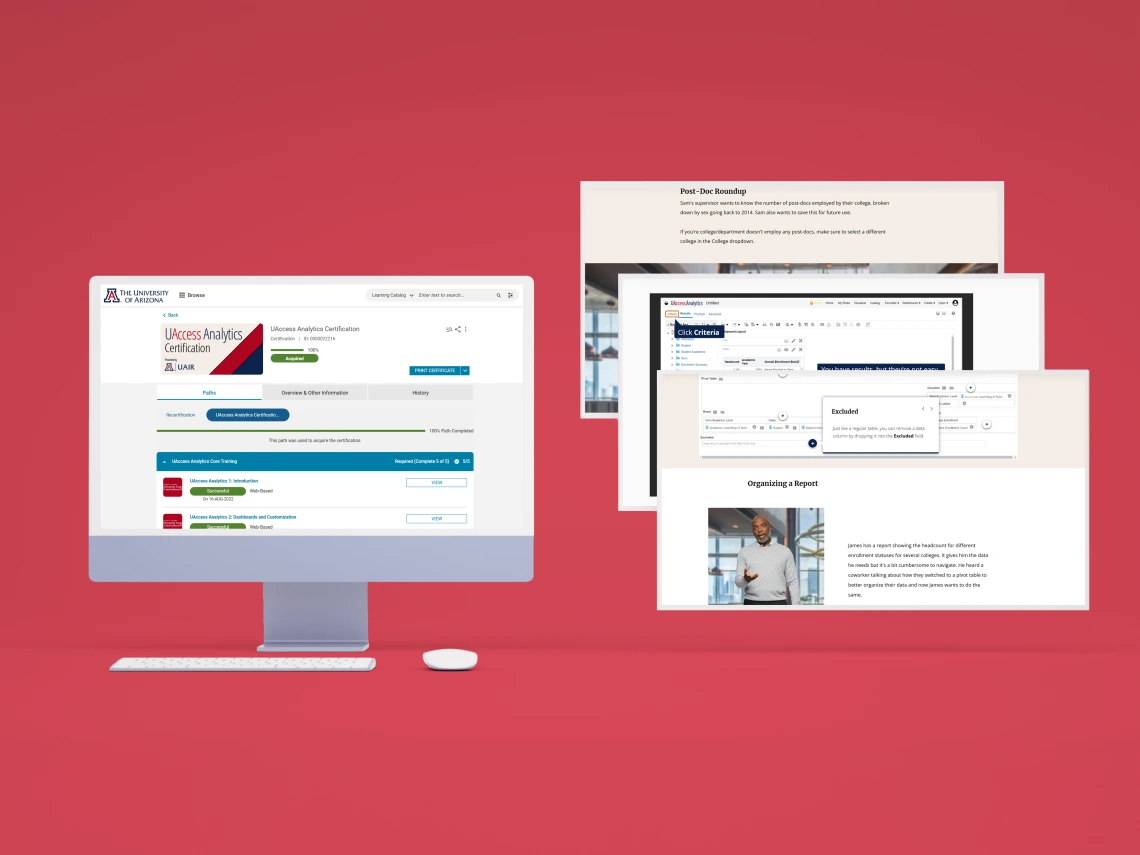
Get certified for UAccess Analytics! Learn essential skills and start your data journey with interactive, easy to follow training in EDGE Learning.

Dashboard Overviews
Check out walkthroughs of UAIR's dashboards and learn how to make the most of them.
NetID login required.

How-To
Build your UAccess Analytics mastery with these bite-size videos covering essential skills.
NetID login required.
UAccess Analytics Training Resources By Topic
Below is an a-la-carte list of educational resources. If you don't see what you're looking for, contact us.
| Working with Dashboards | VIDEO | |
|---|---|---|
| Shared Reports at a Glance | VIDEO (32:41) | |
| Sharing Dashboards | - | VIDEO (1:03) |
| Using the Analyze Link | VIDEO (14:21) | |
| Creating Pages and Subpages | VIDEO (5:55) | |
| Creating a Dashboard Prompt | VIDEO (28:59) | |
| Right-Click Menus | VIDEO (14:00) | |
| Using Selection Steps | VIDEO (13:24) | |
| Request a College or Department Dashboard | - | VIDEO (9:27) |
| Managing Department Dashboard Access with Grouper | VIDEO (7:37) |
| Next Steps (Intermediate) | VIDEO | |
|---|---|---|
| Working with Pivot Tables | - | |
| Using Variables | VIDEO (8:47) | |
| Using an Analysis as a Filter for a Second Analysis | - | |
| Creating Presentation Variables | - | |
| Creating Action Links | - | |
| Working with Bins, Groups, and Calculated Items | - | |
| Constructing and Deconstructing View Selectors | - | |
| Analytics Metadata Wiki | - | |
| Creating Page Breaks for PDF Output | - | |
| Adding Images to Dashboards | - | |
| Exporting Data to Excel & Using Macros to Format | - | |
| Creating Report Selectors | - | |
| Designing Effective Graphs | - |